Section 3.2 Trace points on the 2D Trace Plane
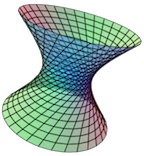
By default, clicking on the 2D trace plane will display the corresponding point on the first surface shown in the 3D plot.
Dragging the input point around in the 2D plot will also move the corresponding function point around on the surface, helping you to see how they are related. The coordinates of the function point are shown both in the green display above the 3D plot and on the plot itself, in the upper left corner.
