Section 1.5 Using the Format Axes dialog
Open the Format Axes dialog by clicking on the Format Axes toolbar button

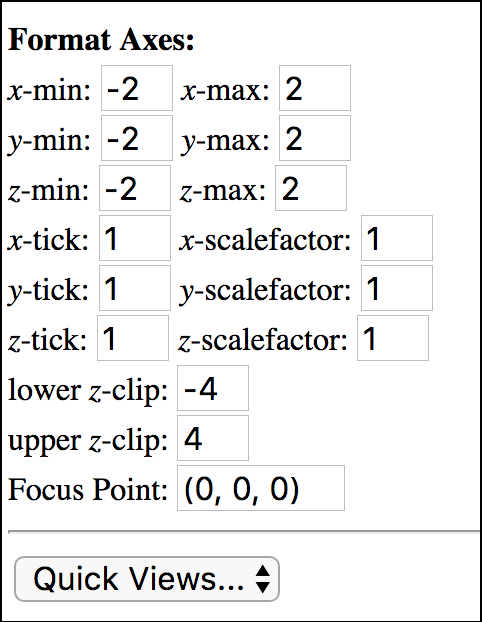
While the Zoom In and Zoom Out buttons allow you to quickly adjust the axes ranges by halving or doubling all values, this dialog allows you to fine tune and adjust the axes ranges, tick mark units, scalefactors, z-clipping, and focus point.
Pressing enter on any of these textbox values should update the plot accordingly.
- Axis ranges
Adjust these values to set the axes ranges on the 3D plot (and the associated traceplane).
- Tick marks
The \(x\)-, \(y\)-, and \(z\)-tick marks indicate a unit to use for spacing the tick marks and associated number labels along each axis. These tick marks and labels will start at the minimum value of the respective axis range.
- Scalefactors
The \(x\)-, \(y\)-, and \(z\)-scalefactors will scale the plot by the given scalefactor in along the given axis. This allows you to create plots where some dimensions are much larger or smaller than others, i.e., this allows the scaling to be non-uniform in the various directions.
- \(z\)-clips
The \(z\)-clipping values will hide all parts of the surface above the upper \(z\)-clip value or below the lower \(z\)-clip value.
- Focus Point
The focus point is the point about which the plot rotates. By default, this point is the origin, but this option allows you to change this pivot/focus point to something else.
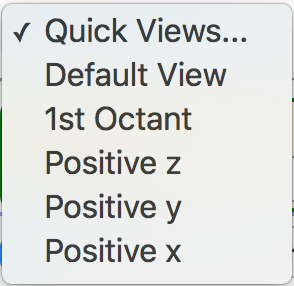
- Quick Views
-
The Quick Views Menu allows you to quickly adjust the plot axes ranges to one of the listed options.