
Section 2.1 Functions of Two-Variables
Subsection 2.1.1 Functions in the form \(z = f(x, y)\)
This is the type of function object that is provided by CalcPlot3D when it opens. But to add a new one, just select the first option Function: z = f(x,y) on the Add to graph drop-down menu, located just below the control panel toolbar buttons. See an image of this object's dialog below.
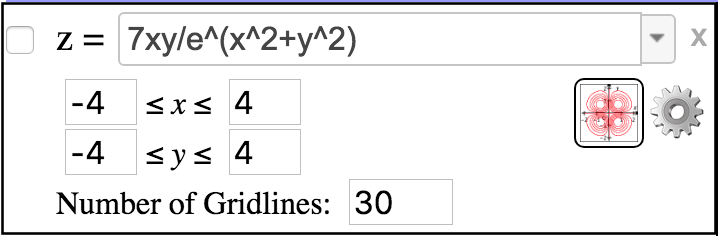
You can enter any function of \(x\) and \(y\) that you wish or select functions from the drop-down menu. See the list of available functions in Appendix A.
When you are ready to plot it, either select the check box on the top left of the object dialog, press enter on the function you typed in the textbox, or click the Graph button.
-
The range of values for \(x\) and \(y\) that is just below the function textbox determines the restricted domain (a rectangle) for this function. Note that unless you change this, it will automatically update to align with the restricted domain of the view window in the plot.
So if you were to change these values to something other than the ranges for the \(x\)- and \(y\)-axes in the Format Axes dialog (see how to use the Format Axes dialog in Section 1.5), this function would keep its independent domain even when you zoom in and out using the respective toolbar buttons.
To realign this function with the axes in the plot, simply adjust the ranges for \(x\) and \(y\) for this function to match those in the plot (and Format Axes dialog).
-
You can vary the number of gridlines used to make the mesh finer or wider. The larger the number of gridlines used, the closer the surface will get to the true graph of the function, but also the more polygons it will take to create it, thus slowing down the plot and rotation process.
Note that you can actually enter two numbers separated by a comma to specify the number of gridlines in both the \(x\)- and \(y\)-directions. So you could enter, for example,
10, 15. This would create this surface plot using 10 gridlines in the \(x\)-direction and 15 gridlines in the \(y\)-direction.When only one number is used, the same number of gridlines is used in both directions.

Use the contour plot button to create a contour plot for this surface. For more details on Contour Plots see Section 5.5.
Use the settings button
⚙\(\faGear\) to adjust surface settings. For a discussion of the options, see Section 2.11.
Subsection 2.1.2 Functions in the form \(x = f(y, z)\)
To add a function of this type select the option Function: x = f(y, z) on the Add to graph drop-down menu, located just below the control panel toolbar buttons. It's near the bottom of the list.

I find this object especially helpful for creating vertical planes to cut a surface defined by a function of \(x\) and \(y\text{.}\)
The options are almost identical to those of the function of \(x\) and \(y\) described above, although there is no option to create a contour plot.
Subsection 2.1.3 Functions in the form \(y = f(x, z)\)
To add a function of this type select the option Function: y = f(x, z) on the Add to graph drop-down menu, located just below the control panel toolbar buttons. It's near the bottom of the list.
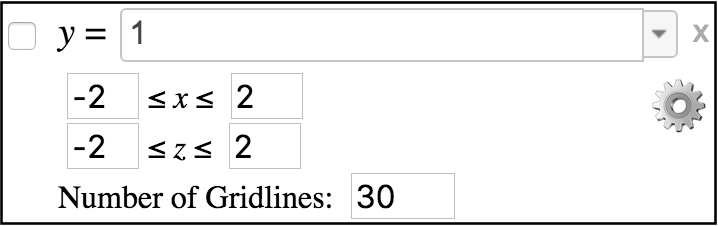
This object is also helpful for creating vertical planes to cut a surface defined by a function of \(x\) and \(y\text{.}\)
The options are again almost identical to those of the function of \(x\) and \(y\) described above, although there is no option to create a contour plot.
Subsection 2.1.4 Functions in Cylindrical Coordinates
Only one of these is implemented so far, although note that any cylindrical or spherical function can already be graphed using an Implicit Surface. See Section 2.7.
-
Functions of the form \(r = f(\theta, z)\)
To add a function of this type select the option
Function: r = f(θ, z)on the Add to graph drop-down menu, located just below the control panel toolbar buttons.
To enter \(\theta\) in your functions, you can either enter
thetaor click the \(\theta\) button in the middle of the range for theta.Note that the ranges for \(\theta\) and \(z\) will not update for this type of function when you zoom in or out using the zooming buttons.
The number of steps in each domain is important in determining the resolution of the cylindrical surface.
Subsection 2.1.5 Functions in Spherical Coordinates
These are not yet implemented in CalcPlot3D. But you can plot these functions already using an Implicit Surface. See Section 2.7.