Section 1.6 Using the Gridlines menu
- Video:
Here is a short video about the Gridlines Menu in CalcPlot3D created by Professor Larry Green of Lake Tahoe Community College.
This menu allows you to modify the way the axes, box, and gridline planes display. You access this menu by clicking on the Gridlines Menu button.

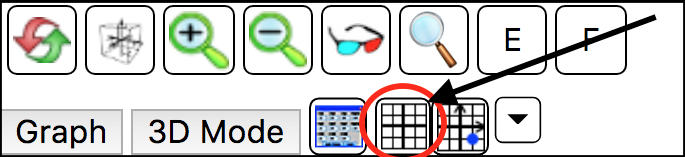
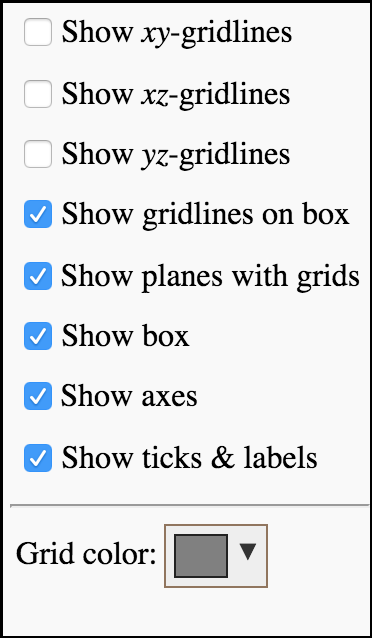
The menu (shown with default options selected on the right) contains the following options:
Show \(xy\)-gridlines: Shows gridlines in the \(xy\)-plane or on the box (if this option is selected).
Show \(xz\)-gridlines: Shows gridlines in the \(xz\)-plane or on the box (if this option is selected).
Show \(yz\)-gridlines: Shows gridlines in the \(yz\)-plane or on the box (if this option is selected).
Show gridlines on box: Moves the visible gridlines from the actual axes-planes to the bounding box.
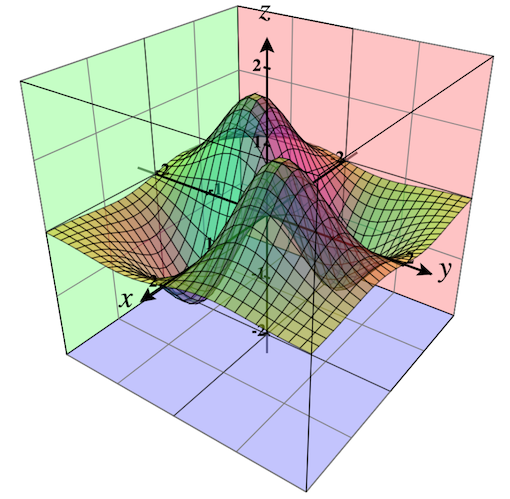
Show planes with grids: Displays planes with the gridlines so they are easier to see.
Show box: Indicates whether to display the plot bounding box or not. The b-key also toggles the presence of this box.
Show axes: Indicates whether to display the coordinate axes or not. The a-key also toggles the presence of the axes.
Show Ticks & Labels: Indicates whether to display the tick marks and numbers labeling the axes.