Section 5.5 *Contour Plots
A contour plot provides a 2D topographical map of a 3D surface, showing contours (or level curves) that trace out the parts of the surface that have the same \(z\)-coordinate.
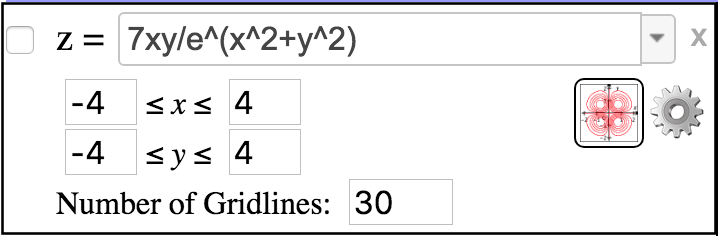
To generate a contour plot of a function of 2 variables in CalcPlot3D, we first need to plot the function we are interested in. Then we will find a contour plot button on the function object that we can use to create the corresponding contour plot.