
Section 3.3 Trace Plane Menu Options
When the 2D trace plane is displayed, a related menu appears just to the right of the trace plane button with additional options. It looks like a downward pointing triangle. See the circled button below.
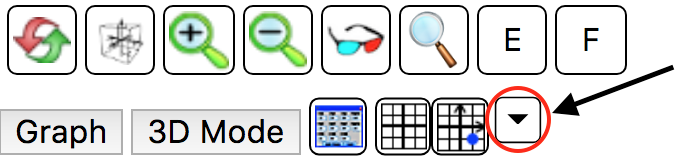
Click on it to view the available options.
Each of these options is described below.
Subsection 3.3.1 Enter trace point
This option allows you to enter a trace point as an ordered pair. Once entered, the point will be plotted on the 2D trace plane and the corresponding point will be shown on the surface in the 3D plot.
Subsection 3.3.2 Show trace point only
This option is to return to the default of only showing a trace point after viewing one of the other objects on this list.
Subsection 3.3.3 Show tangent plane at point
Choosing this option will allow you to see the tangent plane to the first plotted surface at any given point you click on in the 2D trace plane.
You can click and drag the input point around in the trace plane to see the corresponding tangent plane move about on the surface.
Subsection 3.3.4 Show gradient at point on surface
There are two options to display the gradient vector to the surface.
This one displays the gradient vector at the corresponding point on the surface as well as in the 2D trace plane at the input point.
Subsection 3.3.5 Show gradient at input point
This one displays the gradient vector at the input point in the \(xy\)-plane in the 3D plot as well as at the input point in the 2D trace plane.
Subsection 3.3.6 Show normal vector at point
Use this option to display a normal vector on the surface at the selected input point in the 2D trace plane.
Again, you can click-and-drag the input point around in the 2D trace plane to see how the normal vector moves around on the surface in the 3D plot.
Subsection 3.3.7 Show fx trace/tangent line
Choose this option to display a trace curve of the surface at the selected input point that keeps the \(y\)-coordinate fixed and varies the \(x\)-coordinates.
A tangent line to this trace curve will also be displayed at the input point, and the partial derivative of the function with respect to \(x\) will be displayed in the green display above the 3D plot. This value corresponds to the slope of the trace curve (and the surface) at the trace point in the positive \(x\)-direction.
Note that the corresponding point on the surface is also displayed in the upper-left corner of the 3D plot.
Also notice that you can use the sliders or textboxes below the 2D trace plane to vary the input point and see how the slopes change as you move along a single trace curve, as you vary \(x\text{,}\) or how the trace curve and slope change as you vary \(y\text{.}\)
Subsection 3.3.8 Show fy trace/tangent line
Select this option to display a trace curve of the surface at the selected input point that keeps the \(x\)-coordinate fixed and varies the \(y\)-coordinates.
A tangent line to this trace curve will also be displayed at the input point, and the partial derivative of the function with respect to \(y\) will be displayed in the green display above the 3D plot. This value corresponds to the slope of the trace curve (and the surface) at the trace point in the positive \(y\)-direction.
Note that the corresponding point on the surface is also displayed in the upper-left corner of the 3D plot.
Also notice that you can use the sliders or textboxes below the 2D trace plane to vary the input point and see how the slopes change as you move along a single trace curve, as you vary \(y\text{,}\) or how the trace curve and slope change as you vary \(x\text{.}\)
Subsection 3.3.9 Show dir derivative trace
This option will display a trace curve of the surface at the selected input point that is aligned with the displayed direction vector.
A tangent line to this trace curve is displayed at the input point, and the value of the directional derivative of the function in the direction of the direction vector will be displayed in the green display above the 3D plot. This value corresponds to the slope of the trace curve (and the surface) at the trace point in the direction of the direction vector.
The corresponding point on the surface is also displayed in the upper-left corner of the 3D plot.
In the 2D trace plane, you will see two vectors in addition to the input point.
The red vector is the gradient vector to the surface at the selected input point.
The green vector is the normalized (unit length) current direction vector to the surface at the selected input point.
To change the direction of the direction vector, either right-click and drag it around in the 2D trace plane, vary the slider for the angle theta shown below the 2D trace plane, or select the option to enter a direction vector using it's components.
Again, note that there is a slider that allows you to vary only the position of the tangent line along the current trace curve.
Subsection 3.3.10 Enter a direction vector
This option allows you to enter a 2D direction vector (from the \(xy\)-plane) for use with the Show dir derivative trace option above.
Subsection 3.3.11 Hide all objects
Select this option to hide all trace objects in both the 2D trace plane and in the 3D plot.