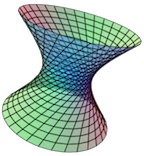
Section B.1 Dynamic Figures with No Controls
These figures can be rotated if they are 3D, and can be manipulated in other ways with the mouse and keystrokes, just as if they were in the full CalcPlot3D app.
But in this type of dynamic figure only the 3D plot window is displayed, while all the menus and controls of the CalcPlot3D app are hidden. See Figure B.1.1 below.
To create this type of dynamic figure:
Create the plot you desire to display in the dynamic figure using CalcPlot3D.
-
Then save the view to the URL using the option on the File menu. (See Subsection 4.1.5.) You'll get a URL something like this:
https://c3d.libretexts.org/CalcPlot3D/index.html?type=z;z=7xy/e^(x^2+y^2);visible=false;umin=0;umax=10;usteps=100;vmin=0;vmax=10;grid=30;format=normal;alpha=-1;constcol=rgb(255,0,0);contourcolor=red&type=spacecurve;spacecurve=curve;x=t+7;y=2t+5;z=1.5t+1;visible=true;tmin=-10;tmax=10;tsteps=100;color=rgb(17,109,192);showtrace=false;tval=2.4000000000000004;constcol=true;twod=false;showpt=true;trace=true;vel=true;acc=true;osc=false;k=false;repeat=false;bounce=false;showtvector=false;shownvector=false;showbvector=false;showtnbeqs=false;showtnblabels=false;showoscplane=false;showrectplane=false;shownormplane=false&type=vector;vector=%3C1,2,1.5%3E;visible=true;color=rgb(255,0,0);size=2;initialpt=(0,0,0)&type=point;point=(7.4,5.8,1.6);visible=true;color=rgb(0,0,0);size=4&type=point;point=(9.4,9.8,4.6);visible=true;color=rgb(0,0,0);size=4&type=text;text=%20%20%20%20%20P%20~%20(x%3Csub%3E0%3C%2Fsub%3E%2C%20y%3Csub%3E0%3C%2Fsub%3E%2C%20z%3Csub%3E0%3C%2Fsub%3E);visible=true;point=(7.4,5.8,1.6);color=rgb(0,0,0);font=Times%20New%20Roman;fontsize=12pt;bold=false;italic=false;fontmath=true;align=Center-right&type=text;text=%20%20%20%20Q%20~%20(x%2C%20y%2C%20z);visible=true;point=(9.4,9.8,4.6);color=rgb(0,0,0);font=Times%20New%20Roman;fontsize=12pt;bold=false;italic=false;fontmath=true;align=Center-right&type=text;text=v%3Charpoon%3E%20~%20%3Ca%2C%20b%2C%20c%3E;visible=true;point=(1,2,1.5);color=rgb(255,0,0);font=Times%20New%20Roman;fontsize=14pt;bold=false;italic=true;fontmath=true;align=Center-left&type=window;hsrmode=1;anaglyph=-1;center=17.139439715453594,10.377939594400079,5.155621864146323,1;focus=5,5,5,1;up=-0.2866219643580234,-0.12700640150211873,0.9495879230092552,1;transparent=false;alpha=140;edgeson=true;faceson=true;showbox=false;showaxes=true;showticks=false;perspective=true;centerxpercent=0.5;centerypercent=0.5;rotationsteps=30;autospin=true;xygrid=true;yzgrid=true;xzgrid=true;gridsonbox=true;gridplanes=false;gridcolor=rgb(128,128,128);xmin=0;xmax=10;ymin=0;ymax=10;zmin=0;zmax=10;xscale=1;yscale=1;zscale=1;zcmin=-4;zcmax=4;zoom=0.305882;xscalefactor=1;yscalefactor=1;zscalefactor=1 Copy the part of the URL after the question mark to paste into the appropriate HTML code shown below.
Now typically we need to place the dynamic figure in an
iframe, although this is hidden from the user in PreTeXt. Copy and paste the code below, depending on your situation.
LibreTexts and many other HTML web pages.
In order to get a dynamic figure that hides all the menus and controls of the CalcPlot3D app, we need to use a slightly different URL.
The URL for a dynamic figure with no controls is:
https://c3d.libretexts.org/CalcPlot3D/dynamicFigure/index.html
Note that the data for the figure is encoded in a query string by CalcPlot3D. This means that we will need a question mark (?) just after the URL above and then we'll paste the data copied from the CalcPlot3D-generated URL. If we were to enter this new URL and query string in the browser directly, we would get the dynamic figure by itself on the page.
To get the figure(s) on a page, especially if you might wish to place more than one of these dynamic figures on the same page, it is useful to embed each dynamic figure in an iframe (so they won't interfere with each other). I choose to make the width of this iframe 90% or less so there is still space on each side to scroll up and down past the figure.
Below you can see a listing of the code for Figure B.1.1 when it is displayed in LibreTexts or a generic webpage.
<p style="text-align:center">
<iframe frameborder="0" height="480px"
src="https://c3d.libretexts.org/CalcPlot3D/dynamicFigure/index.html?type=
z;z=7xy/e^(x^2+y^2);visible=false;umin=0;umax=10;usteps=100;vmin=0;vmax=10;grid=30;
format=normal;alpha=-1;constcol=rgb(255,0,0);contourcolor=red&
type=spacecurve;spacecurve=curve;x=t+7;y=2t+5;z=1.5t+1;visible=true;tmin=-10;tmax=10;
tsteps=100;color=rgb(17,109,192);showtrace=false;tval=2.4000000000000004;constcol=true;
twod=false;showpt=true;trace=true;vel=true;acc=true;osc=false;k=false;repeat=false;
bounce=false;showtvector=false;shownvector=false;showbvector=false;showtnbeqs=false;
showtnblabels=false;showoscplane=false;showrectplane=false;shownormplane=false&
type=vector;vector=%3C1,2,1.5%3E;visible=true;color=rgb(255,0,0);size=2;initialpt=(0,0,0)&
type=point;point=(7.4,5.8,1.6);visible=true;color=rgb(0,0,0);size=4&
type=point;point=(9.4,9.8,4.6);visible=true;color=rgb(0,0,0);size=4&
type=text;text=%20%20%20%20%20P%20~%20(x%3Csub%3E0%3C%2Fsub%3E%2C%20y%3Csub%3E0%3C%2Fsub%3E%2C%20z%3Csub%3E0%3C%2Fsub%3E);
visible=true;point=(7.4,5.8,1.6);color=rgb(0,0,0);font=Times%20New%20Roman;fontsize=12pt;
bold=false;italic=false;fontmath=true;align=Center-right&
type=text;text=%20%20%20%20Q%20~%20(x%2C%20y%2C%20z);visible=true;point=(9.4,9.8,4.6);
color=rgb(0,0,0);font=Times%20New%20Roman;fontsize=12pt;bold=false;italic=false;
fontmath=true;align=Center-right&
type=text;text=v%3Charpoon%3E%20~%20%3Ca%2C%20b%2C%20c%3E;
visible=true;point=(1,2,1.5);color=rgb(255,0,0);font=Times%20New%20Roman;fontsize=14pt;
bold=false;italic=true;fontmath=true;align=Center-left&
type=window;hsrmode=1;anaglyph=-1;center=17.139439715453594,10.377939594400079,5.155621864146323,1;
focus=5,5,5,1;up=-0.2866219643580234,-0.12700640150211873,0.9495879230092552,1;
transparent=false;alpha=140;edgeson=true;faceson=true;showbox=false;showaxes=true;
showticks=false;perspective=true;centerxpercent=0.5;centerypercent=0.5;rotationsteps=30;
autospin=true;xygrid=true;yzgrid=true;xzgrid=true;gridsonbox=true;gridplanes=false;
gridcolor=rgb(128,128,128);xmin=0;xmax=10;ymin=0;ymax=10;zmin=0;zmax=10;xscale=1;
yscale=1;zscale=1;zcmin=-4;zcmax=4;zoom=0.305882;xscalefactor=1;yscalefactor=1;zscalefactor=1"
width="90%">
</iframe>
</p>
PreTeXt.
When inserting a dynamic figure created with CalcPlot3D into a PreTeXt document, we need to use the following PreTeXt construction.
<figure>
   <caption>dynamic figure</caption>
   <interactive calcplot3d="Querystring from CalcPlot3D"
                variant="minimal"
                width="90%">
      <static>
         <image source="location of a static image of the dynamic figure for PDF output" width="50%" />
      </static>
   </interactive>
</figure>
For the example shown in Figure B.1.1 above, this construction looks like:
<figure>
<caption>dynamic figure</caption>
<interactive calcplot3d="type=z;z=7xy/e^(x^2+y^2);visible=false;umin=0;umax=10;usteps=100;vmin=0;vmax=10;grid=30;format=normal;alpha=-1;constcol=rgb(255,0,0);contourcolor=red&type=spacecurve;spacecurve=curve;x=t+7;y=2t+5;z=1.5t+1;visible=true;tmin=-10;tmax=10;tsteps=100;color=rgb(17,109,192);showtrace=false;tval=2.4000000000000004;constcol=true;twod=false;showpt=true;trace=true;vel=true;acc=true;osc=false;k=false;repeat=false;bounce=false;showtvector=false;shownvector=false;showbvector=false;showtnbeqs=false;showtnblabels=false;showoscplane=false;showrectplane=false;shownormplane=false&type=vector;vector=%3C1,2,1.5%3E;visible=true;color=rgb(255,0,0);size=2;initialpt=(0,0,0)&type=point;point=(7.4,5.8,1.6);visible=true;color=rgb(0,0,0);size=4&type=point;point=(9.4,9.8,4.6);visible=true;color=rgb(0,0,0);size=4&type=text;text=%20%20%20%20%20P%20~%20(x%3Csub%3E0%3C%2Fsub%3E%2C%20y%3Csub%3E0%3C%2Fsub%3E%2C%20z%3Csub%3E0%3C%2Fsub%3E);visible=true;point=(7.4,5.8,1.6);color=rgb(0,0,0);font=Times%20New%20Roman;fontsize=12pt;bold=false;italic=false;fontmath=true;align=Center-right&type=text;text=%20%20%20%20Q%20~%20(x%2C%20y%2C%20z);visible=true;point=(9.4,9.8,4.6);color=rgb(0,0,0);font=Times%20New%20Roman;fontsize=12pt;bold=false;italic=false;fontmath=true;align=Center-right&type=text;text=v%3Charpoon%3E%20~%20%3Ca%2C%20b%2C%20c%3E;visible=true;point=(1,2,2.25);color=rgb(255,0,0);font=Times%20New%20Roman;fontsize=14pt;bold=false;italic=true;fontmath=true;align=Center&type=window;hsrmode=1;anaglyph=-1;center=17.139439715453594,10.377939594400079,5.155621864146323,1;focus=5,5,5,1;up=-0.2866219643580234,-0.12700640150211873,0.9495879230092552,1;transparent=false;alpha=140;edgeson=true;faceson=true;showbox=false;showaxes=true;showticks=false;perspective=true;centerxpercent=0.4;centerypercent=0.5;rotationsteps=30;autospin=true;xygrid=true;yzgrid=true;xzgrid=true;gridsonbox=true;gridplanes=false;gridcolor=rgb(128,128,128);xmin=0;xmax=10;ymin=0;ymax=10;zmin=0;zmax=10;xscale=1;yscale=1;zscale=1;zcmin=-4;zcmax=4;zoom=0.15;xscalefactor=1;yscalefactor=1;zscalefactor=1"
variant="minimal"
width="60%">
<static>
<image source="images/staticline3d.png" width="50%"/>
</static>
</interactive>
</figure>
