
Section 2.11 Surface Settings, ⚙
Function settings are the same for the following objects:
Function: z = f(x,y)Function: x = f(y,z)Function: y = f(x,z)Implicit SurfaceParametric SurfaceRegionFunction: r = f(θ,z)
You can find this settings menu by clicking on the settings button ⚙ for the surface object whose settings you wish to adjust.
Using these settings, you can then adjust these formatting options for this surface only, leaving settings for other surfaces unaffected.
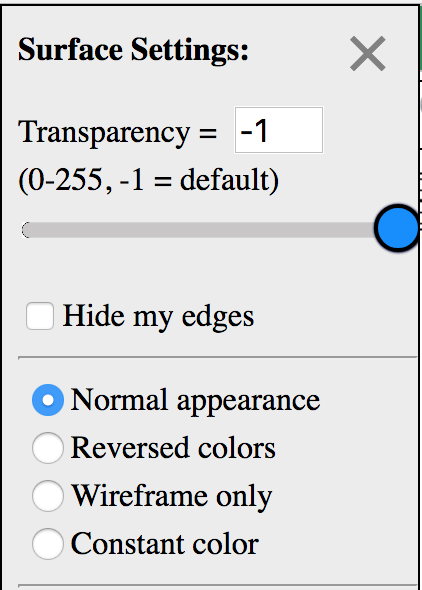
Subsection 2.11.1 Transparency
You can adjust the transparency of the whole plot with the Toggle Transparency button.

But in the Surface Settings menu, you can adjust the transparency of a single surface so that it is not affected by the general transparency setting.
The initial transparency value of -1 forces the surface to use the default plot transparency mentioned above.
Adjusting this value using the scrollbar or by entering a value from 0 (fully invisible) to 255 (fully opaque) will set the transparency value for this surface, and make it not follow the plot transparency setting.
Subsection 2.11.2 Hide my edges
Similar to transparency, you can adjust whether the polygon edges are displayed in the whole plot with the Toggle Edges button.

But in the Surface Settings menu, you can hide the polygon edges of a single surface so that it is not affected by the general edge display setting.
This is a checkbox, that is unchecked by default. Selecting this option will force the edges of this surface to be hidden without affecting any other surfaces in the plot.
Subsection 2.11.3 Coloring the surface faces
These options allow you to change the coloring setting for a single surface.
By default, the colors of surface faces are determined by the three components of a normal vector to the face.
When two intersecting surfaces are plotted together one of them is automatically set to Reversed colors so the intersection of the surfaces is easier to see. Note that when two or more surfaces intersect in the plot, the Hidden Surface Mode is also automatically changed to BSP Tree Mode (not triangulated) to improve the resolution of the intersection.
But in the Surface Settings menu, you can adjust the way the faces of a single surface are colored.
Now let's look at each of the options for coloring the surface faces.
Normal appearance: The default coloring scheme based on the components of the normal vector to each face.
Reversed colors: Each face is colored using the same coloring scheme but using the components of the negative of the normal vector. This results in coloring the top of the surface as the bottom would have been colored in the Normal appearance mode and coloring the bottom as if it were the top.
Wireframe only: All faces for this surface are hidden and the surface is displayed as a wireframe. Note that using the Toggle Faces button will Hide/Show faces for the whole plot. But changing the coloring setting in Surface Settings will lock this surface to be displayed as indicated here.
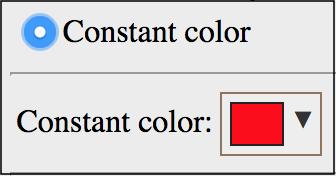
Constant color: Selecting this option will cause a color picker panel to appear just below these surface coloring options and will color the surface red (or the last selected color). You can then use the color picker to select a desired color for both sides of the entire surface.
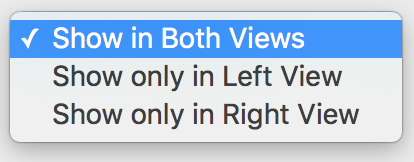
Subsection 2.11.4 Two views dropdown
This option will appear here only if the Show two views option is selected on the View Settings submenu of the CalcPlot3D main menu.

It allows you to choose in which of the side-by-side two views you wish each surface to appear. By default, it will appear in both views. You are given the following options.
For more information on turning this mode on and how it works, see Subsection 4.5.3.